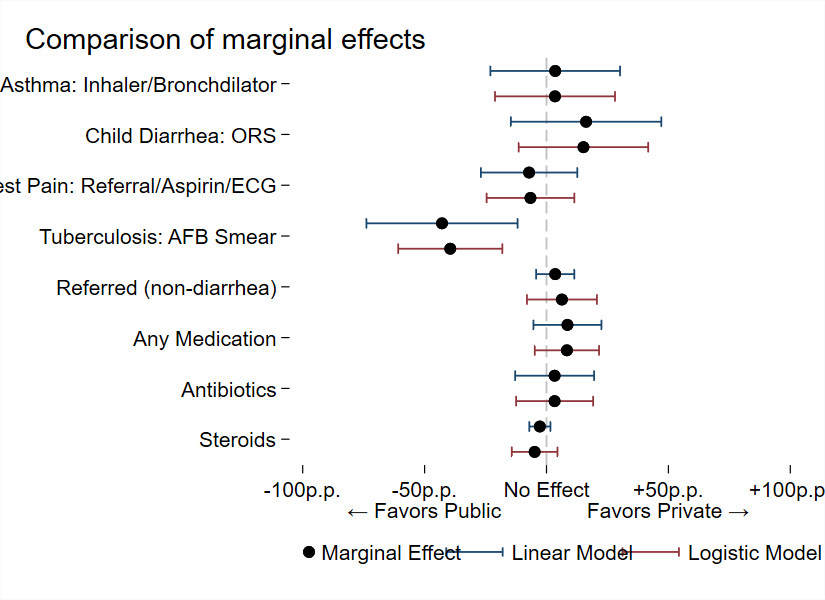
绘制上图的Stata代码如下:
* Figure: Comparison of marginal effects from linear and logistic specifications

    global graph_opts title(, justification(left) color(black) span pos(11)) graphregion(color(white)) ylab(,angle(0) nogrid) xtit(,placement(left) justification(left)) yscale(noline) xscale(noline) legend(region(lc(none) fc(none)))

    use "http://ds.epiman.cn/uploads/2022/06/reg-models.dta" , clear

    cap mat drop theResults
    local theLabels ""
    local x = 15.5

    qui foreach var of varlist ??_correct refer med_any med_class_any_6 med_class_any_16 {

        local theLabel : var label `var'
        local theLabels `"`theLabels' `x' "`theLabel'""'
        local x = `x' - 2

        reg `var' facility_private i.case_code

        mat a = r(table)

        local b = a[1,1]
        local ll = a[5,1]
        local ul = a[6,1]
        mat a = [`b',`ll',`ul',1]
        mat rownames a = "`var'"

        logit `var' facility_private i.case_code
        margins , dydx(facility_private)

        mat b = r(table)

        local b = b[1,1]
        local ll = b[5,1]
        local ul = b[6,1]
        mat b = [`b',`ll',`ul',2]
        mat rownames b = "`var'"

        mat theResults = nullmat(theResults) \ a \ b

        }

    mat colnames theResults = "b" "ll" "ul" "type"
    matlist theResults

    clear
    svmat theResults , names(col)

    gen n = _n
    replace n = 17-n
    tw ///
        (rcap ll ul n if type == 1 , hor lc(navy)) ///
        (scatter n b if type == 1 , mc(black)) ///
        (rcap ll ul n if type == 2 , hor lc(maroon)) ///
        (scatter n b if type == 2 , mc(black)) ///
        , ///
        ${graph_opts} ///
        ylab(`theLabels') ///
        ytit(" ") ///
        xlab(-1 "-100p.p." -.5 `""-50p.p." "{&larr} Favors Public""' 0 "No Effect" .5 `""+50p.p." "Favors Private {&rarr}""' 1 "+100p.p.") ///
        xline(0 , lc(gs12) lp(dash)) ///
        legend(order(2 "Marginal Effect" 1 "Linear Model" 3 "Logistic Model") r(1))

* Have a lovely day!
* Source:https://worldbank.github.io/stata-visual-library/reg-models.html