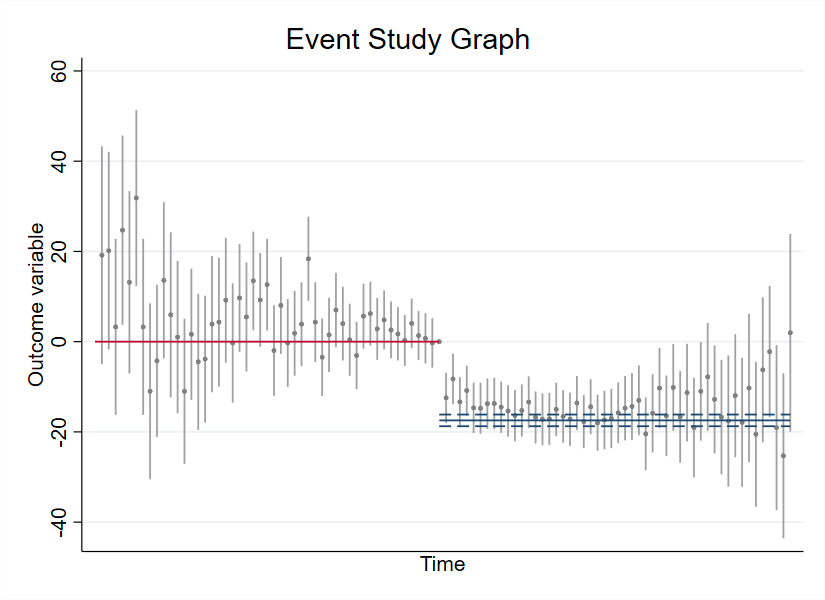
Stata绘制上图的代码如下:
/*******************************************************************************

				Figure: Simple event study graph

********************************************************************************
    PART 1: Load data
********************************************************************************/

	use "https://github.com/worldbank/stata-visual-library/raw/master/Library/data/eventstudy-prepost.dta", clear

/********************************************************************************
    PART 2: Run regression and prepare data
********************************************************************************/

/*------------------------------------------------------------------------------
	PART 2.1: Get time point of reference
------------------------------------------------------------------------------*/

	sum t
	local tmax = r(max)
	local tmin = r(min)

	sum t if post == 0
	local tevent = r(max)	// This is the base period
	local tpostmin = `tevent'

/*------------------------------------------------------------------------------
	PART 2.2: Calculate post-event average
------------------------------------------------------------------------------*/

	reg y post

	mat results = r(table)

	local postcons = results[1,1]
	local postll = results[5,1]
	local postul = results[6,1]

/*------------------------------------------------------------------------------
	PART 2.3: Calculate effect for each ride
------------------------------------------------------------------------------*/

	reg y ib`tevent'.t	// t = 0 is the time of the event

	* Load the results as the data set so they're easier to handle
	mat pointest = r(table)
	mat pointest = pointest'

/*------------------------------------------------------------------------------
	PART 2.4: Load results as data so they can be plotted
------------------------------------------------------------------------------*/

	clear
	svmat pointest, names(col)
	local lastobs  = _N
	gen time = _n
	drop in `lastobs'			// this is the constant

/********************************************************************************
    PART 3: Plot
********************************************************************************/

	tw  (rspike ul ll time, msize(tiny) color(gs10)) ///
		(scatter b time, msize(tiny) color(gs8)) ///
		(scatteri 0 0 0 `tevent', recast(connected) msymbol(none) lcolor(cranberry)) ///
		(scatteri `postcons' `tevent' `postcons' `tmax', recast(connected) msymbol(none) lcolor(navy)) ///
		(scatteri `postul' `tevent' `postul' `tmax', recast(connected) lpattern(dash) msymbol(none) lcolor(navy)) ///
		(scatteri `postll' `tevent' `postll' `tmax', recast(connected) lpattern(dash) msymbol(none) lcolor(navy)) ///
		, ///
		graphregion(color(white)) ///
		legend(off) ///
		xlabel(none) ///
		xtitle(Time) ///
		ytitle(Outcome variable)
* Have a lovely day!
* Source: https://worldbank.github.io/stata-visual-library/eventstudy-prepost.html