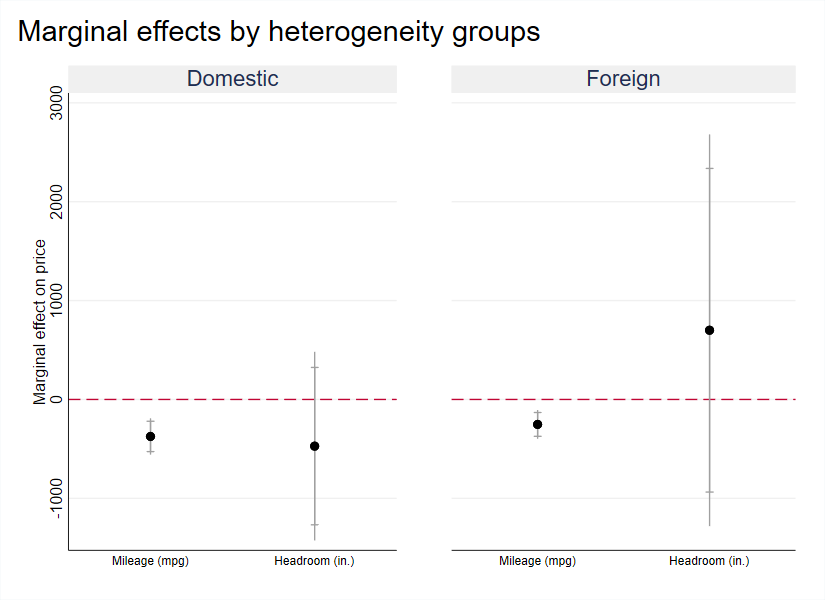
绘制上图的Stata代码如下:
/*******************************************************************************

			FIGURE: Marginal effects by heterogeneity gorups

********************************************************************************/

	sysuse auto, clear

/*--------------------------------------------------------------------------------
       PART 1: Prepare options
-------------------------------------------------------------------------------*/

	local label1 Foreign
	local label0 Domestic

	* Supress y axis labels on graph to the right so it's only shown once on
	* combined graph
	local yopts1 ylab(, labcolor(white)) ///
				 ytitle("") ///
				 yscale(noline)

	gr drop _all

/*-------------------------------------------------------------------------------
       PART 2: Create individual graphs
-------------------------------------------------------------------------------*/

	* Loop over heterogeneity variables
	forvalues foreign = 0/1 {

		* Run regression to get margin effect
		* -----------------------------------
		reg price mpg headroom if foreign == `foreign'

		* Plot marginal effect by group
		* -----------------------------
		coefplot ///
			   , ///
			    drop(_cons) /// don't show constant
				vertical ///
				yline(0, lpattern(dash)) /// for significance
				ciopt(color(gs10 gs10) ///
					  recast(rcap)) ///
				levels(90 95) /// show 90% and 95% CIs
				ylab(, noticks glcolor(gs15)) ///
				xlab(, noticks labsize(small)) ///
				xtitle("") ///
				ytitle("Marginal effect on price") ///
				title(`label`foreign'', box bexpand bcolor(gs15)) /// add title in box
				color(black) ///
				name(f`foreign') ///
				graphregion(color(white)) ///
				`yopts`foreign''


	}

/*-------------------------------------------------------------------------------
       PART 3: Combine graphs
-------------------------------------------------------------------------------*/

	gr combine 	f0 f1, ///
				ycommon ///
				graphregion(color(white))

******************************** The end ***************************************
* Have a lovely day!
* Source: https://worldbank.github.io/stata-visual-library/reg-het.html