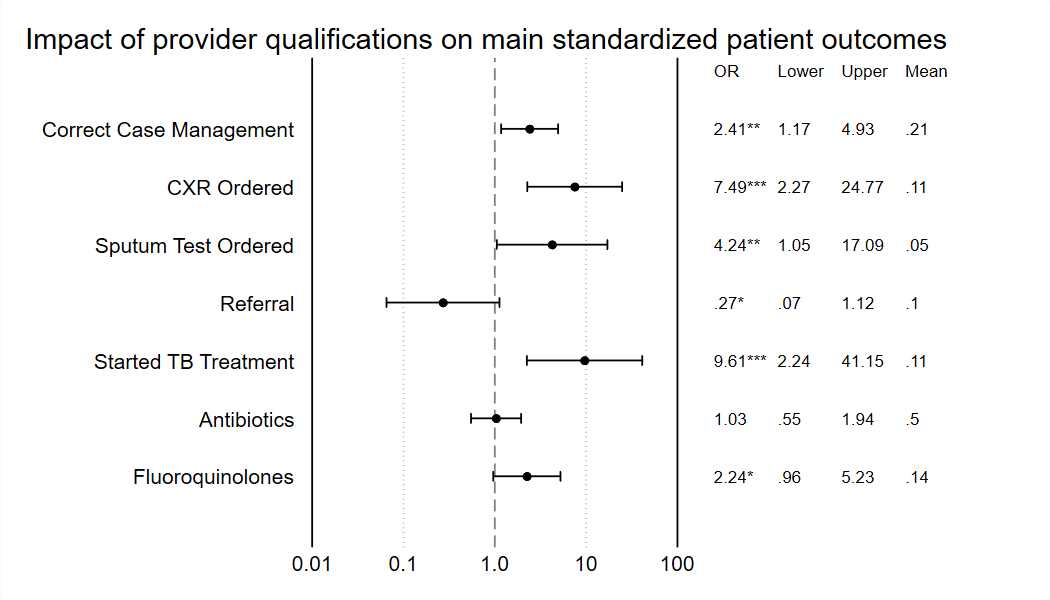
绘制上图的Stata代码如下:
** Master file for results replication.
** Please note that tables will be produced in "raw" form and require manual recombination and/or formatting to match the finished tables.

* Load adofiles

    * These files are created by the authors for the purposes of this study and are not publicly available for general use.
    * These files are not guaranteed to produce appropriate statistics other than those contained in this replication file.

    qui do "http://ds.epiman.cn/uploads/2022/06/chartablesheet.ado"

    * In addition, this dofile relies on two other publicly available STATA extensions:
        * firthlogit, in package firthlogit from http://fmwww.bc.edu/RePEc/bocode/f
        * estadd, in package st0085_2 from http://www.stata-journal.com/software/sj14-2
        * xml_tab, in package dm0037 from http://www.stata-journal.com/software/sj8-3

        *Use findit to install each package

    version 13

* Figure 2. Impact of provider qualifications on main standardized patient outcomes

    use "http://ds.epiman.cn/uploads/2022/06/reg-chartable.dta", clear

    * Sample Restriction Logic
    global cxr "& sp_case <3"
    global sputum "& sp_case <3"
    global sp_drugs_tb "& sp_case >2"

    * Output
    chartable correct cxr sputum s5_referral sp_drugs_tb sp_drugs_antibio sp_drugs_quin ///
        using "results.xlsx" ///
        , ///
        c(xi: firthlogit) ///
        rhs(q_mbbs pro_age pro_male patients_waiting_in i.sp_id) or p globalif


* Have a lovely day!
* Source: https://worldbank.github.io/stata-visual-library/reg-chartable.html