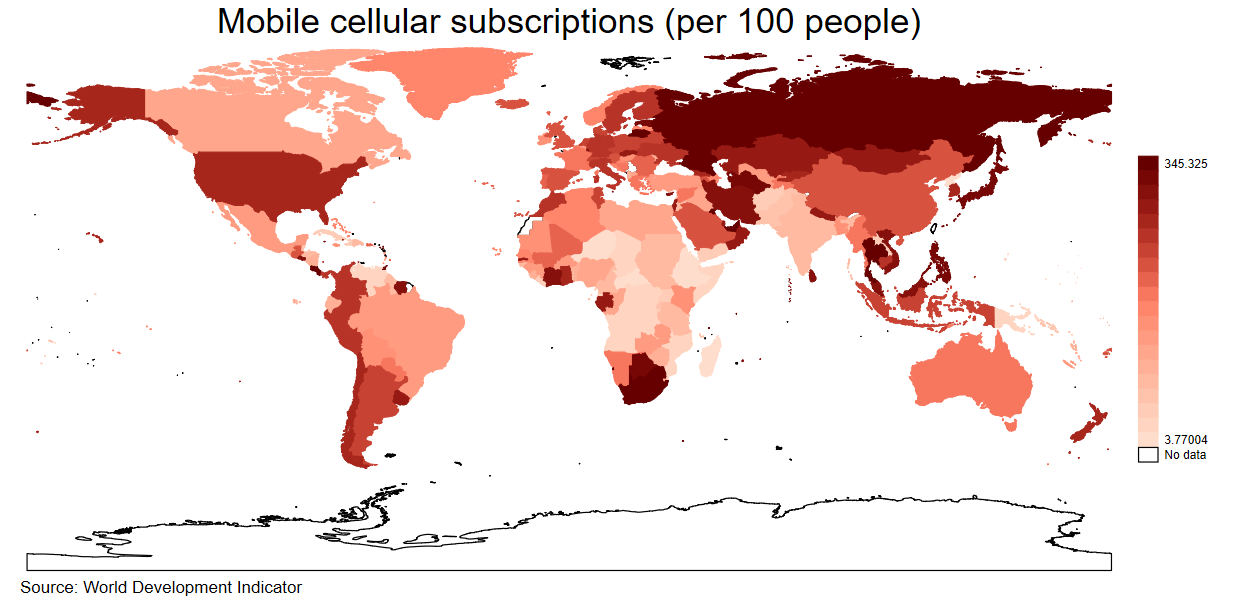
绘制上图的Stata代码如下:
* Maps displaying levels of a variable

* ------------------------------------------------------------------------------
*    Packages
* ------------------------------------------------------------------------------

    ssc install spmap
    ssc install shp2dta

* ------------------------------------------------------------------------------
*     Data
* ------------------------------------------------------------------------------

    foreach format in shp dbf prj shx {
        copy "https://github.com/worldbank/stata-visual-library/raw/master/Library/data/map-world.`format'" "map-world.`format'"
    }

    *Shapefiles
    shp2dta using "map-world.shp", ///
        database(world_shape) /// Source: http://www.naturalearthdata.com/downloads/110m-cultural-vectors/
        coordinates(world_shape_coord) ///
        genid(id)

    *Correct iso_a2
    use  world_shape, clear
    drop if iso_a2=="-99"

    merge 1:1 iso_a2 using "https://github.com/worldbank/stata-visual-library/raw/master/Library/data/map-world.dta" ///
        , ///
        keep(1 3) nogen

* ------------------------------------------------------------------------------
*     Map
* ------------------------------------------------------------------------------

    spmap jobs_scarce_code using world_shape_coord if admin! = "Antarctica" ///
        , ///
        id(id) ///
        fcolor(Reds) osize(.1) ocolor(black) ///
        clmethod(custom)  clbreaks(0 .2 .40 .6 .8 1)  ///
        legend(position(8) ///
               region(lcolor(black)) ///
               label(1 "No data") ///
               label(2 "0% to 20%") ///
               label(3 "20% to 40%") ///
               label(4 "40% to 60%") ///
               label(5 "60% to 80%") ///
               label(6 "80% to 100%")) ///
        legend(region(color(white))) ///
        plotregion(icolor(bluishgray)) ///
        title("When jobs are scarce, men should have more of a right to a job than women.") ///
        subtitle("Agreement with the statement above by country") ///
        note("Source: World Values Survey (2014 or last available year)")

* Have a lovely day!
* Source: https://worldbank.github.io/stata-visual-library/map-world.html