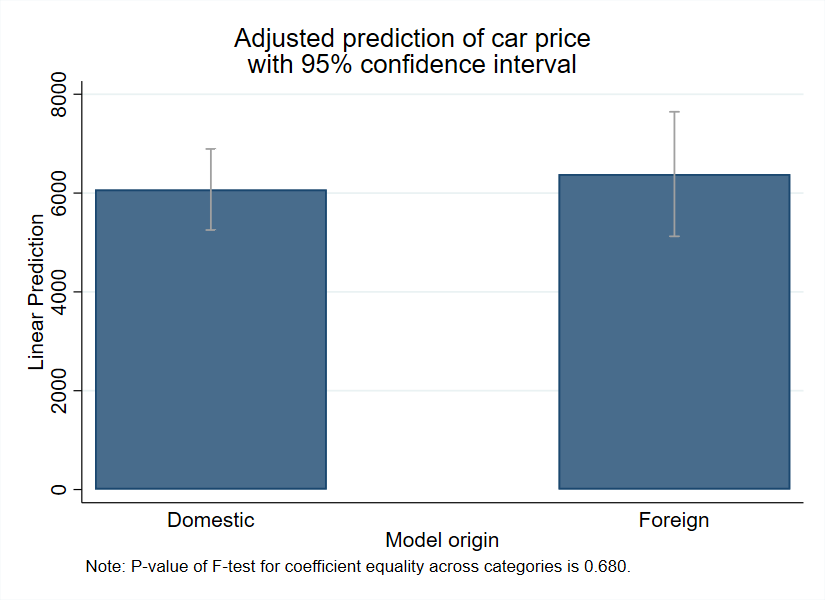
绘制上图的Stata代码如下:
	sysuse auto, clear

	reg price ibn.foreign

	* Test if take up if the same across positive opportunity cost levels, then
	* create and format local to add to the graph as text
	test 1.foreign == 0.foreign
	local pval : di %5.3f `r(p)'
	local pval = trim("`pval'")

	* Calculate the predicted value for each category
	margins foreign

	* Create plot
	marginsplot, ///
		recast(bar) ///
		plotopts(barwidth(0.5) bargap(10)) ///
		ciopts(recast(rcap) color(gs10)) ///
		ylabel(0(2000)8000) ///
		title("Adjusted prediction of car price" "with 95% confidence interval") ///
		xlabel(, noticks) ///
		xtitle(Model origin) ///
		graphregion(color(white)) ///
		note(Note: P-value of F-test for coefficient equality across categories is `pval'.)
* Have a lovely day!
* Source: https://worldbank.github.io/stata-visual-library/reg-predicted.html