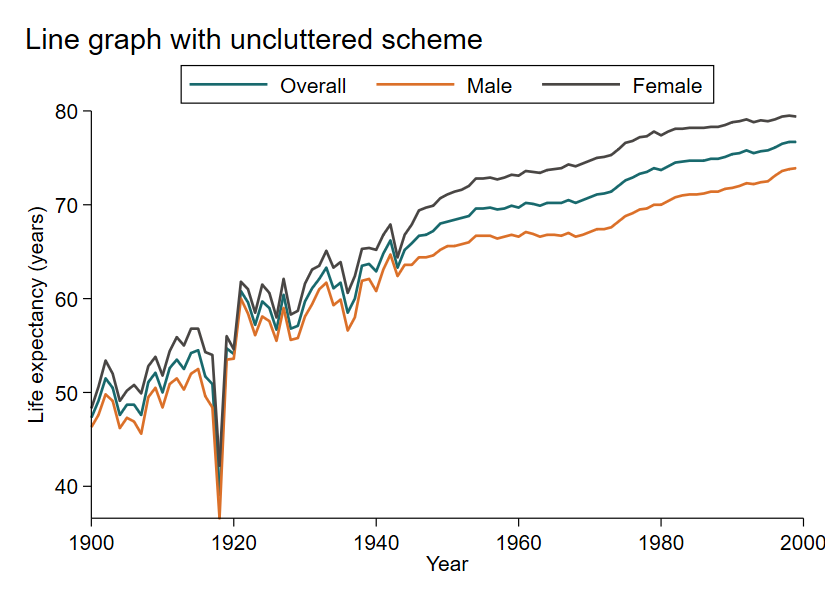
绘制上图的Stata代码如下:
    * FIGURE: Line graph with uncluttered scheme
    * Load built-in data
    sysuse uslifeexp

    * Change scheme: scheme needs to be manually installed. Instruction on how
    * to this can be found in https://gray.kimbrough.info/uncluttered-stata-graphs/
    set scheme uncluttered

    * Create graph
    line le le_male le_female year       ///
        ,                                ///
         ytitle(Life expectancy (years)) ///
         legend(on                       /// Scheme supresses the legend by default
                order(1 "Overall"        /// Set label to show up in legend
                      2 "Male"           ///
                      3 "Female")        ///
                cols(3)                  /// Show all legends in one line (3 columns)
                pos(12))                 //  Show legend on top of graph

* Have a lovely day!
* Source: https://worldbank.github.io/stata-visual-library/line-uncluttered.html