绘制上图的Stata代码如下:
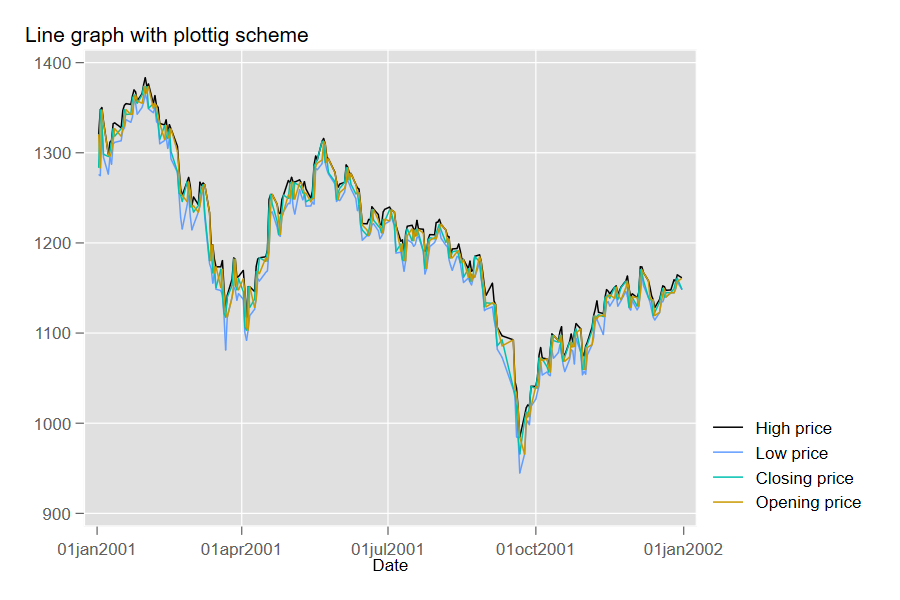
    * FIGURE: Line graph with plottig scheme
    * Install user-written graph scheme
    ssc install blindschemes, replace

    * Select graph scheme (similar to R's ggplot2)
    set scheme plottig

    * Load built-in data
    sysuse sp500, clear

    * Create graph: show time series for 4 variables
    tw  (line high date) ///
        (line low date) ///
        (line close date) ///
        (line open date)
* Have a lovely day!
*Source:https://worldbank.github.io/stata-visual-library/line-plottig.html