绘制上图的Stata命令如下:
*Figure: Scatter plot with fitted line and confidence interval
* Load data
use "https://github.com/worldbank/stata-visual-library/raw/master/Library/data/scatter-fl-ci.dta", clear
*数据不存在*
* Graph
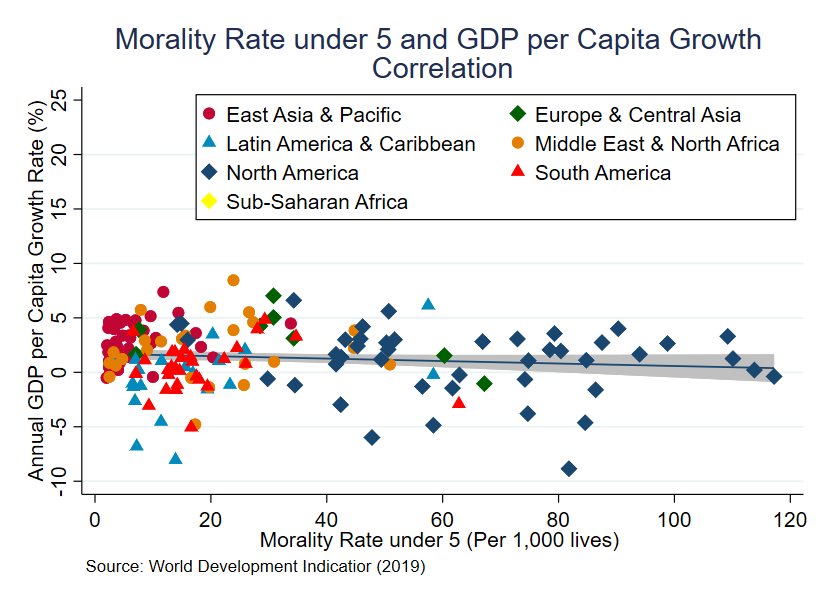
twoway ///
(lfitci jobs_scarce_code avg_growth ) ///
(scatter jobs_scarce_code avg_growth if continent == "Africa", mcolor(cranberry) m(O) ) ///
(scatter jobs_scarce_code avg_growth if continent == "Asia", mcolor(dkgreen) m(D) ) ///
(scatter jobs_scarce_code avg_growth if continent == "Europe", mcolor(ebblue ) m(T) ) ///
(scatter jobs_scarce_code avg_growth if continent == "North America", mcolor(dkorange) m(O)) ///
(scatter jobs_scarce_code avg_growth if continent == "Oceania", mcolor(navy) m(D) ) ///
(scatter jobs_scarce_code avg_growth if continent == "South America", mcolor(red) m(T)) ///
, ///
xlabel(-5(5)15) ///
xtitle("Average Annual GDP per Capita Growth Rate (%)", axis(1)) ///
ylabel(0(0.2)1) ///
ytitle("Gender Value Indicator" ) ///
legend(order( 3 4 5 6 7 8) label(3 "Africa") label(4 "Asia") label(5 "Europe") ///
label(6 "North America") label(7 "Oceania") label(8 "South America") ///
ring(0) position(4)) ///
title("Gender Value Indicator and GDP per Capita Growth" "Correlation") ///
note("Source: World Values Survey (2014 or last available year) and World Bank") ///
graphregion(color(white)) bgcolor(white)
* Have a lovely day!
* Source: https://worldbank.github.io/stata-visual-library/scatter-fl-ci.html