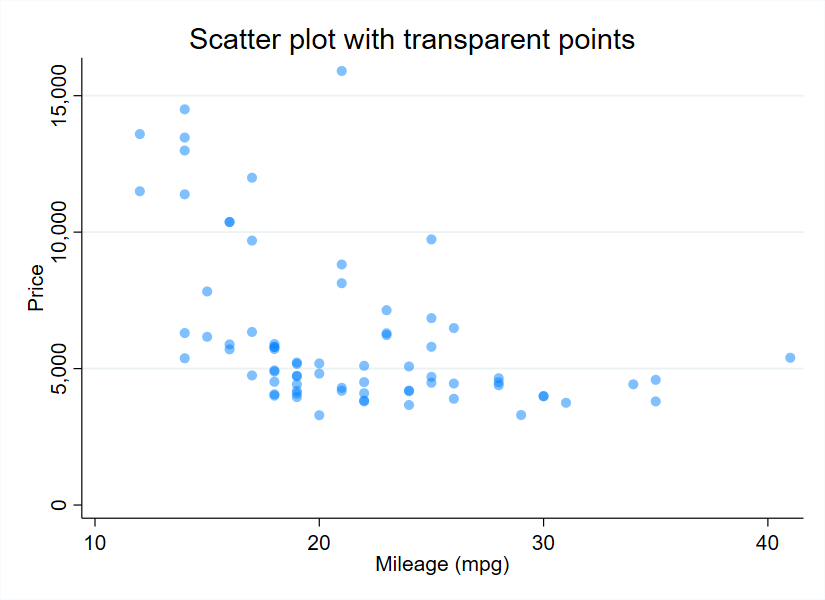
*FIGURE: Scatter plot with transparent points
	sysuse auto, clear

	scatter price mpg ///
		, ///
		mcolor(midblue%50) /// the value after % sets the transparency
		mlwidth(0) /// 		set width of border to 0
		graphregion(color(white))

* Have a lovely day!
* Source: https://worldbank.github.io/stata-visual-library/scatter-transparent.html