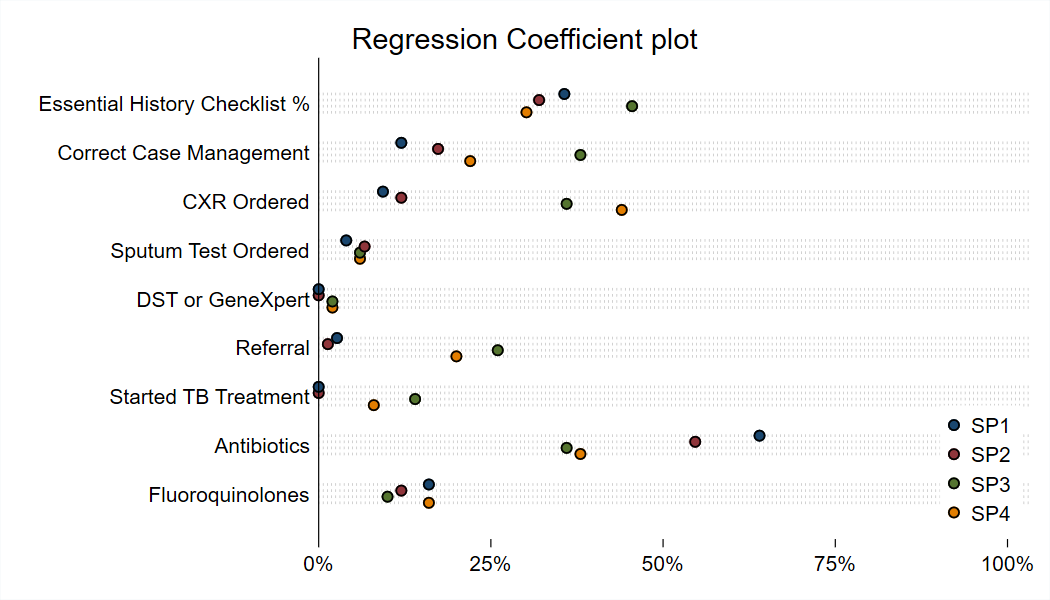
绘制上图的Stata命令如下:
* Install necessary commands ******************************************************************

    * Custom commands defined in ado files:
    * freeshape: reshapes wide data into long without requiring variables names of
    *            the variables to be shaped numbered stub.
    * labelcollapse: preserves variable labeling while performing collapse.

    run "http://ds.epiman.cn/uploads/2022/06/freeshape.ado"
    run "http://ds.epiman.cn/uploads/2022/06/labelcollapse.ado"

    * In addition, this dofile relies on two other publicly available STATA extensions:
    * firthlogit, in package firthlogit from http://fmwww.bc.edu/RePEc/bocode/f
    * estadd, in package st0085_2 from http://www.stata-journal.com/software/sj14-2
    * xml_tab, in package dm0037 from http://www.stata-journal.com/software/sj8-3


* Load and prepare data ***********************************************************************

    * Load data from GitHub
    use "http://ds.epiman.cn/uploads/2022/06/scatter-strata.dta", clear

    * Collapse and reshape data
    labelcollapse    essential correct cxr sputum dstgx s5_referral sp_drugs_tb sp_drugs_antibio sp_drugs_quin, by(sp_case)
    freeshape        essential correct cxr sputum dstgx s5_referral sp_drugs_tb sp_drugs_antibio sp_drugs_quin, i(sp_case) j(var)

    * Assign ordered number
    local x = 1
    gen order = 0

    qui foreach name in essential correct cxr sputum dstgx s5_referral sp_drugs_tb sp_drugs_antibio sp_drugs_quin {
        replace order = `x' if var_name == "`name'"
        local ++x
    }

*  Create graph *******************************************************************************

    graph dot var_value    ///
        ,    ///
        asy over(sp_case) over(var_label, sort(order)) ///
        linegap(20) ///
        graphregion(color(white)) ///
        xsize(7) ///
        legend(region(lc(none) fc(none))) ///
        yscale(noline) ytit("") ylab(0 "0%" .25 "25%" .5 "50%" .75 "75%" 1 "100%") ///
        linetype(line) lines( lp(.) lc(gs11)) ///
        legend(pos(5) ring(0) c(1) region(lc(white) fc(white))) ///
        marker(1, m(O) mlcolor(black)) ///
        marker(2, m(O) mlcolor(black)) ///
        marker(3, m(O) mlcolor(black)) ///
        marker(4, m(O) mlcolor(black))
* Have a lovely day!
* Source: https://worldbank.github.io/stata-visual-library/scatter-strata.html