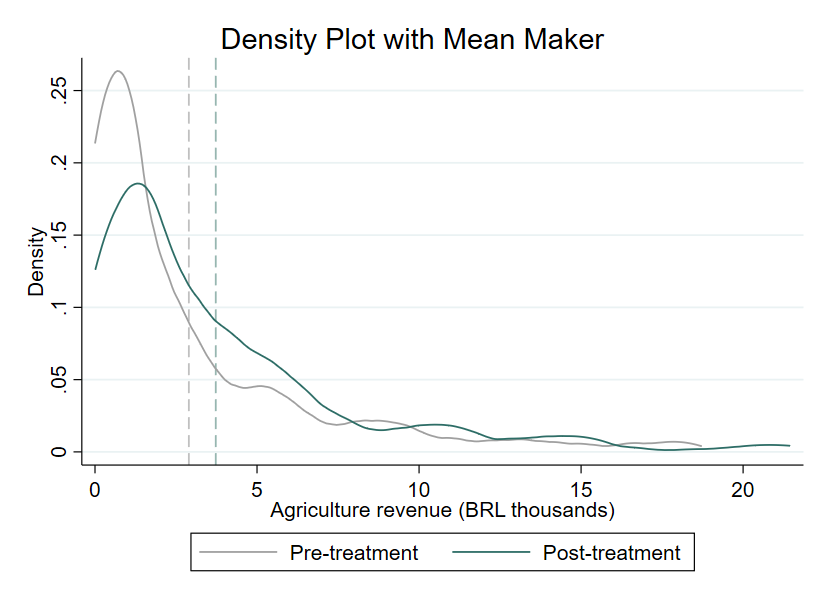
绘制上图的Stata命令如下:
/**********************************************************************************
               FIGURE: kernel density graph with mean marker
**********************************************************************************/

    * Load data
    * ---------
    use "http://ds.epiman.cn/uploads/2022/06/density-av.dta", clear

    * Calculate means
    * ---------------
    sum     revenue if post == 0
    local   pre_mean = r(mean)
    sum     revenue if post == 1
    local   post_mean = r(mean)

    * Plot
    * ----
    twoway  (kdensity revenue if post == 0, color(gs10)) ///
            (kdensity revenue if post == 1, color(emerald)) ///
         , ///
            xline(`pre_mean', lcolor(gs12) lpattern(dash)) ///
            xline(`post_mean', lcolor(eltgreen) lpattern(dash)) ///
            legend(order(1 "Pre-treatment" 2 "Post-treatment")) ///
            xtitle(Agriculture revenue (BRL thousands)) ///
            ytitle(Density) ///
            bgcolor (white) graphregion(color(white))

* Have a lovely day!
* Source: https://worldbank.github.io/stata-visual-library/density-av.html