绘制上图的Stata命令如下:
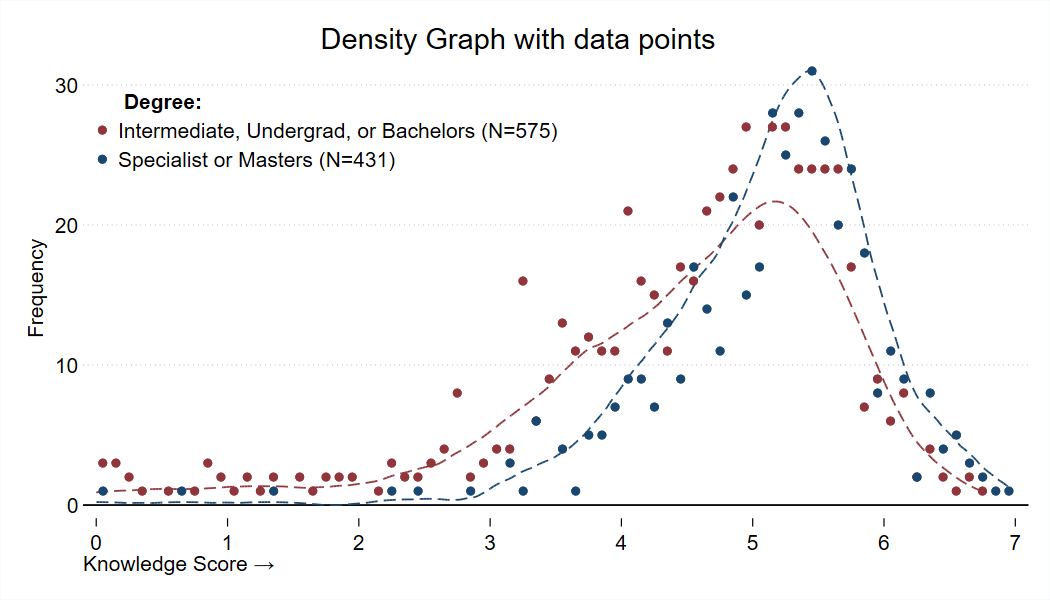
* Figure: Density graph with data points

    global graph_opts title(, justification(left) color(black) span pos(11)) ///
        graphregion(color(white)) ylab(,angle(0) nogrid notick) xscale(noline) yscale(noline) yline(0 , lc(black)) ///
        xtit(,placement(left) justification(left)) legend(region(lc(none) fc(none)))

    global hist_opts ylab(, angle(0) axis(2)) yscale(noline alt axis(2)) ///
        ytit(, axis(2)) ytit(, axis(1)) yscale(off axis(2)) yscale(alt)

    use "http://ds.epiman.cn/uploads/2022/06/density-data.dta"  , clear

    qui su theta_mle

    gen score = theta_mle - `r(min)'
    gen bach = roster_6a8 > 4

    tw ///
        (kdensity score if bach == 0 , lp(dash) lc(maroon) yaxis(2)) ///
        (kdensity score if bach == 1 , lp(dash) lc(navy) yaxis(2)) ///
        (histogram score if bach == 0 , freq w(.1) recast(scatter) msize(small) mc(maroon)) ///
        (histogram score if bach == 1 , freq w(.1) recast(scatter) msize(small) mc(navy)) ///
        , ///
        legend(symxsize(small) ///
               order(0 "" 0 "" 0 "{bf: Degree:}" ///
                     3 "Intermediate, Undergrad, or Bachelors (N=575)" ///
                     4 "Specialist or Masters (N=431)") ///
               c(1) pos(11) ring(0)) ///
        ${graph_opts} ${hist_opts} ///
        xtit("Knowledge Score {&rarr}") xlab(0(1)7) yline(10 20 30 , lc(gs12) lp(dot)) xsize(7)

* Have a lovely day!
* Source: https://worldbank.github.io/stata-visual-library/density-data.html