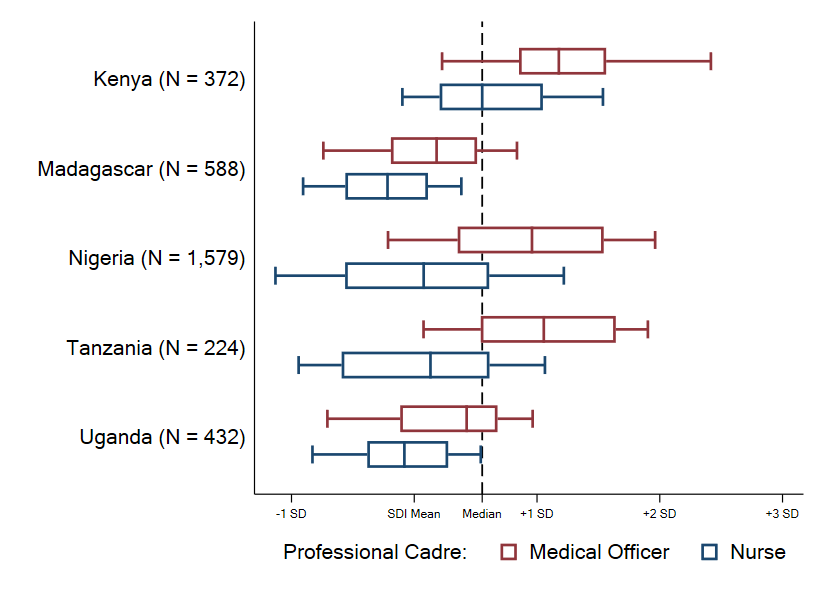
绘制上图的Stata命令如下:
* Figure: 10-25-50-75-90 percentile box plot

    global  graph_opts1 bgcolor(white) graphregion(color(white)) legend(region(lc(none) fc(none))) ///
            ylab(,angle(0) nogrid) title(, justification(left) color(black) span pos(11)) subtitle(, justification(left) color(black))

    use "http://ds.epiman.cn/uploads/2022/06/boxplot-pctile.dta" , clear

    * Graph (10-25-50-75-90 pctiles)

    collapse (p10) p10=competence_mle (p25) p25=competence_mle (p50) p50=competence_mle ///
             (p75) p75=competence_mle (p90) p90=competence_mle ///
            , ///
              by(provider_cadre country)

    reshape long p, i(provider_cadre country)

    replace country = "Kenya (N = 372)" if regexm(country,"Kenya")
    replace country = "Madagascar (N = 588)" if regexm(country,"Madagascar")
    replace country = "Nigeria (N = 1,579)" if regexm(country,"Nigeria")
    replace country = "Tanzania (N = 224)" if regexm(country,"Tanzania")
    replace country = "Uganda (N = 432)" if regexm(country,"Uganda")

    graph   box p ///
            ,  ///
            hor over(provider_cadre) over(country ) ///
            legend(order(0 "Professional Cadre:" 1 "Medical Officer" 2 "Nurse") r(1) symxsize(small) symysize(small)  pos(6) ring(1)) ///
            asy $graph_opts1 ylab(-1 "-1 SD" 0 "SDI Mean" .553483 "Median" 1 "+1 SD" 2 "+2 SD" 3 "+3 SD", labsize(vsmall)) ytit("") note("") ///
            lintensity(.5) yline(.553483 , lc(black) lp(dash)) ///
            box(1 , fi(0) lc(maroon) lw(medthick)) box(2, fc(white) lc(navy) lw(medthick))

* Have a lovely day!
* Source: https://worldbank.github.io/stata-visual-library/boxplot-pctile.html