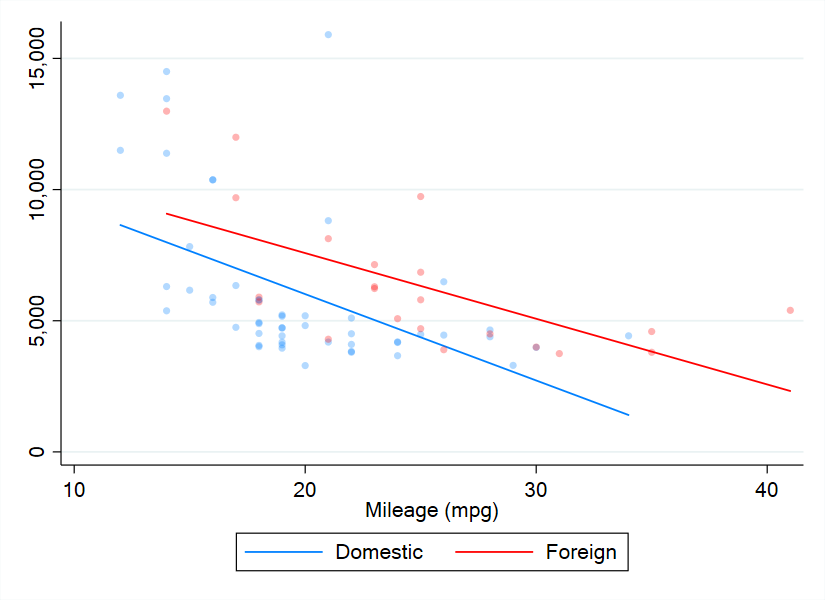
绘制上图的Stata命令如下:
*Figure: scatter plot with fitted line

    * Load data
    * ---------
   sysuse auto, clear

    * Set graph options
    * ----
   local col_domestic 	midblue
   local col_foreign  	red
   local transparency   %30
   local point_width	0
   local point_size		small

    * Plot
    * ----
    twoway  (scatter price mpg if foreign == 0, mfcolor(`col_domestic'`transparency') msize(`point_size') mlwidth(`point_width')) ///
            (lfit price mpg if foreign == 0, color(`col_domestic')) ///
            (scatter price mpg if foreign == 1, mfcolor(`col_foreign'`transparency') msize(`point_size')  mlwidth(`point_width')) ///
            (lfit price mpg if foreign == 1, color(`col_foreign')) ///
         , ///
            graphregion(color(white)) ///
			legend(order(2 "Domestic" 4 "Foreign"))


* Have a lovely day!
* Source: https://worldbank.github.io/stata-visual-library/scatter-fl.html