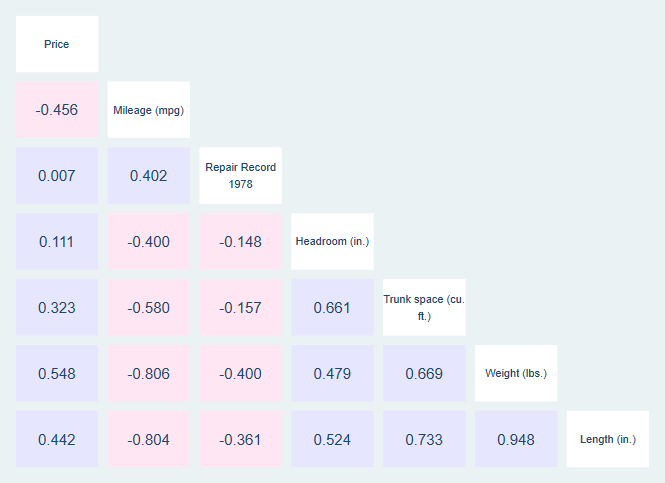
前几天有位EpiMan的坛友询问上面的图如何在Stata中实现,写一个教程,供参考。
Stata中实现相关矩阵热图的社区命令为corrtable,该命令由英国杜伦大学 (Durham University) 的Nicholas J. Cox教授开发,生成热图时有些慢,需要耐心等待几十秒。
先安装Stata社区命令:
* Install corrtable if necessary
ssc install corrtable,replace
再载入演示数据:
* Get auto data
sysuse auto.dta, clear
最后生成热图:
* Make correlation table
corrtable price-length, ///
half ///
flag1(r(rho) > 0) howflag1(plotregion(color(blue*0.1))) ///
flag2(r(rho) < 0) howflag2(plotregion(color(pink*0.1)))
选项说明:
half选项只生成下三角矩阵(Lower Triangle Matrix)。
flag 和howflag 是配对选项,flag1(r(rho) > 0) howflag1(plotregion(color(blue * 0.1))) 配对选项将相关系数为正的矩阵标为蓝色,而flag2(r(rho) < 0) howflag2(plotregion(color(pink*0.1))) 配对选项将相关系数为负的矩阵标为粉红色。
rsize是调节系数大小显示的选项,如rsize(2 + 6 * abs(r(rho)))。
参考:https://lost-stats.github.io/Presentation/Figures/heatmap_colored_correlation_matrix.html
完,本文内容交流请移步:https://www.epiman.cn/thread-267057-1-1.html